
 Chandra Wibowo
Bitcoin (BTC) has recently encountered significant headwinds in its attempt to firmly establish the $80,000 mark as a supportive base. While bulls have been pushing for upward momentum, new analysis from on-chain intelligence firm Glassnode suggests that the cryptocurrency’s true test of resilience is yet to unfold, pinpointing a crucial resistance zone between $81,000 and $86,000. This critical price band represents a confluence of various on-chain liquidity structures and technical indicators, posing a significant hurdle for sustained price appreciation.
The Crucial Overhead Liquidity Structures
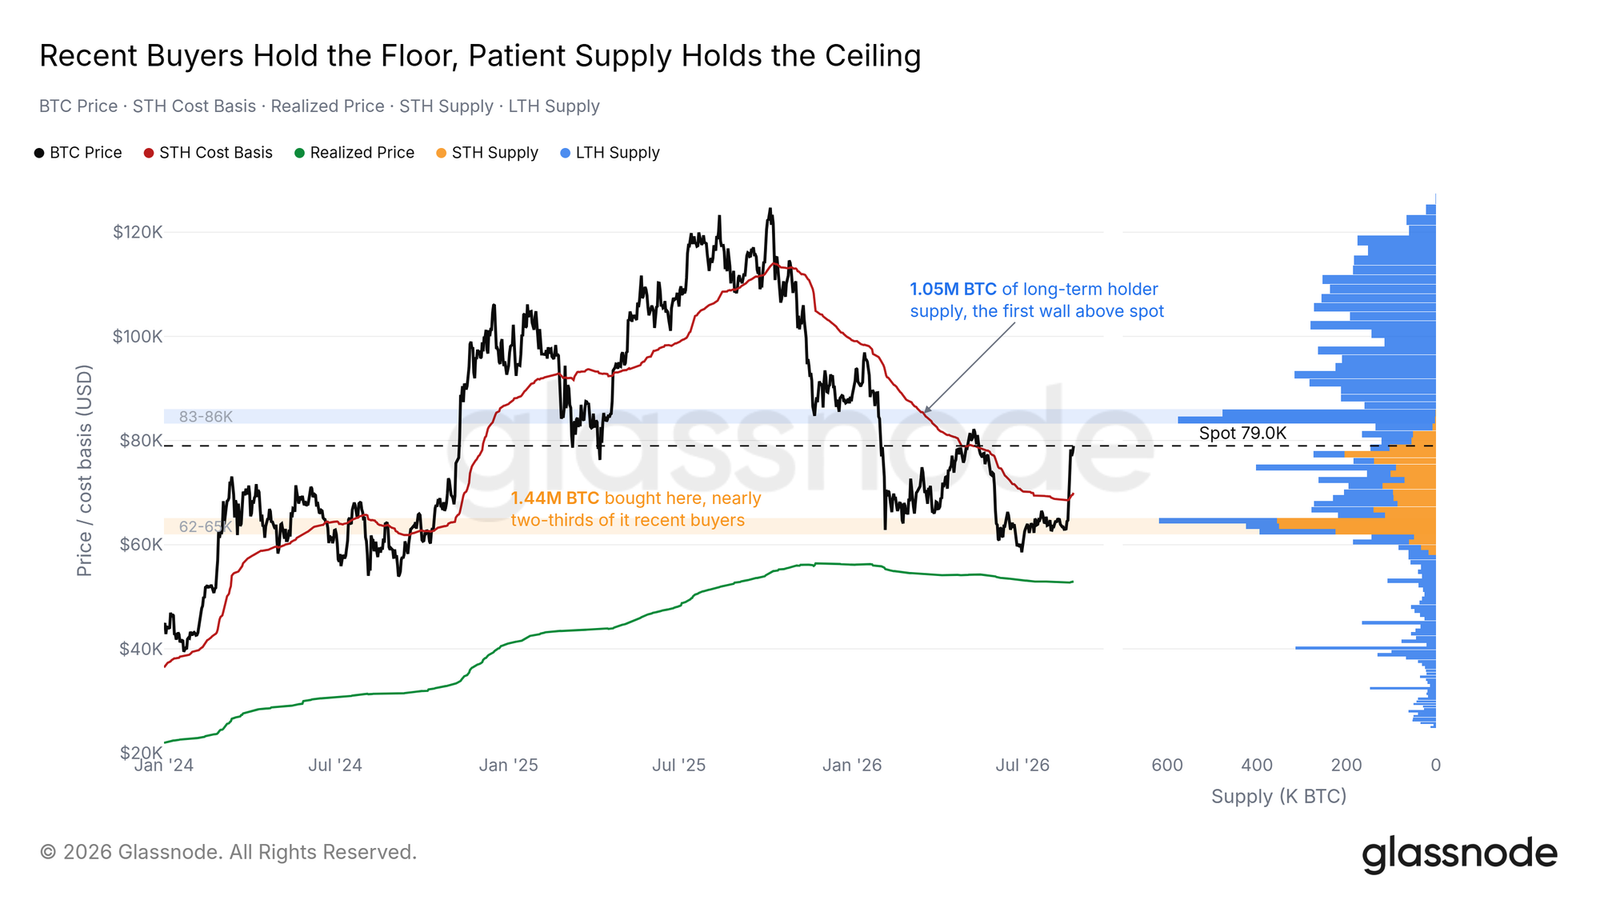
Glassnode, in its latest edition of "The Week Onchain," has identified substantial pools of Bitcoin supply situated within the $81,000 to $86,000 range. These liquidity structures are particularly influenced by long-term holders (LTHs), a segment of the market characterized by their conviction and historical tendency to weather market downturns without liquidating their holdings. LTHs are defined as holders who have kept their BTC in their wallets for at least six months.
According to Glassnode’s research, the primary "heavy structure" of overhead supply lies between $83,000 and $86,000. This segment is largely comprised of LTH supply that has patiently endured the entirety of recent market drawdowns. The analysis posits that a sustained move towards $83,000 will critically test the resolve of these long-term holders, potentially forcing them to sell at or near their breakeven points to exit their positions. This could introduce significant selling pressure, acting as a formidable resistance to further upside.
Understanding Long-Term Holder Behavior
The behavior of LTHs is a key indicator in the Bitcoin market. These investors, often considered the bedrock of the market’s stability, typically acquire BTC during periods of lower prices and hold through volatility, anticipating future price appreciation. When Bitcoin approaches their cost basis, particularly after a prolonged period of holding, the temptation to secure profits or minimize losses can become substantial. This psychological barrier, amplified by the sheer volume of LTH supply in the $83,000-$86,000 zone, presents a significant challenge for bulls.
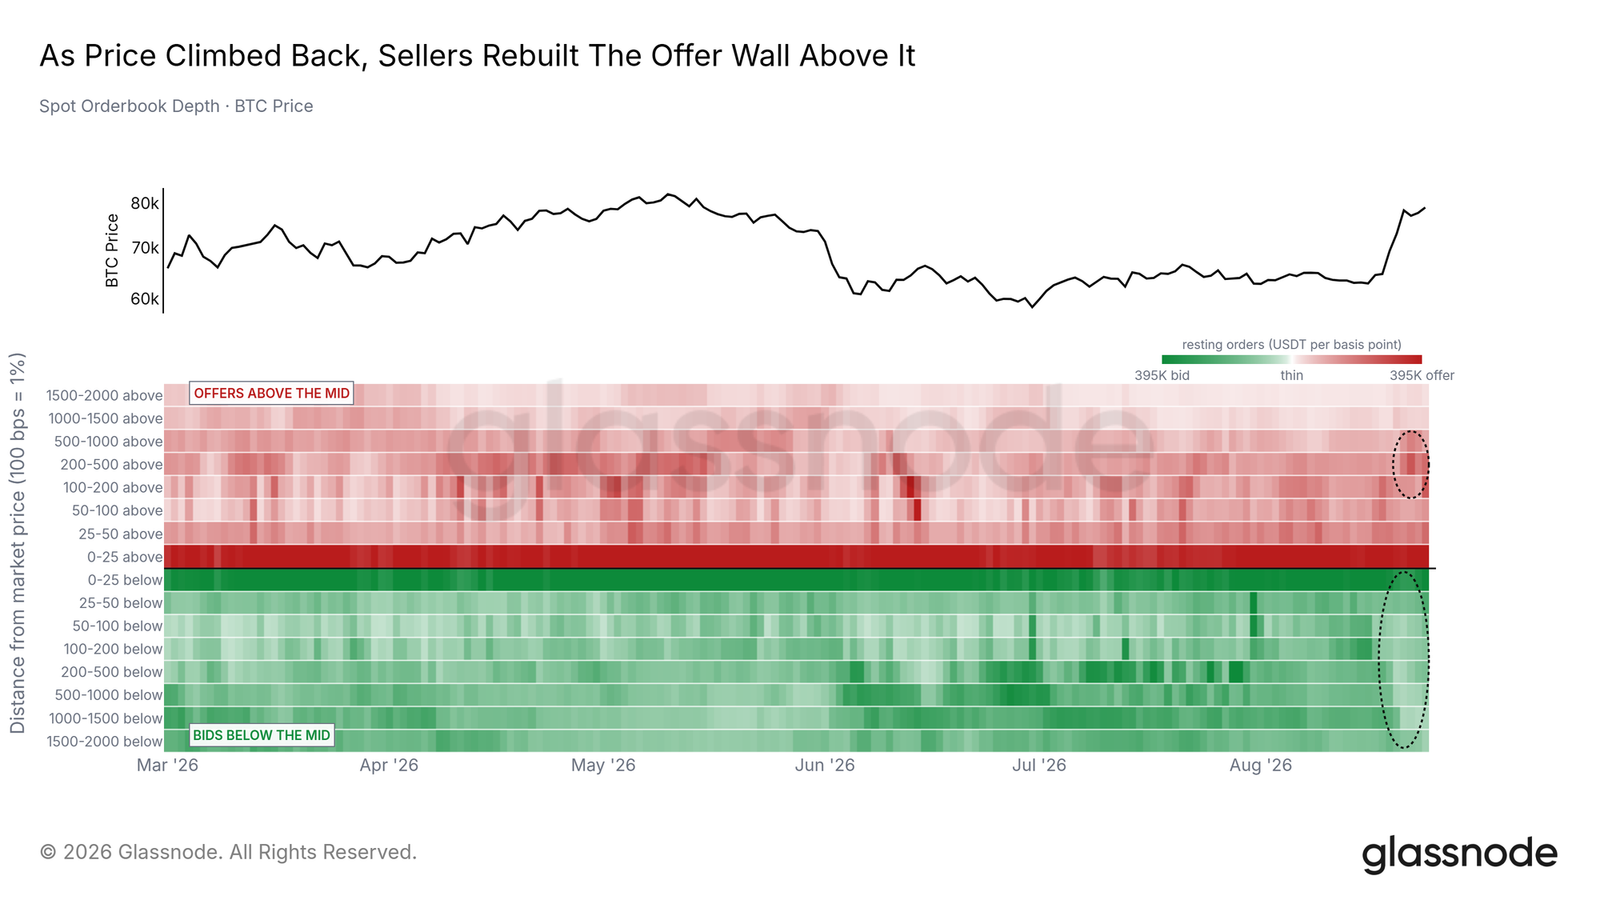
Furthermore, the research highlights the emergence of new "ask liquidity" on exchange order books within this price band. While some of these orders may be strategically placed by market participants to signal intent and potentially deter further price drops, others could represent genuine selling interest. The interplay between these buy and sell orders within a concentrated price range can create significant volatility and resistance.

Glassnode’s detailed breakdown of the overhead structures reveals a multi-faceted resistance:
- Self-Custody Cost Basis Shelf: This begins around $80,800, representing the average cost basis of Bitcoin held in self-custody wallets. When the price moves above this level, a larger number of holders are in profit, potentially increasing selling pressure.
- Dealer Gamma Flip: At $82,300, the "dealer gamma" is projected to turn negative. Gamma represents the rate of change of an option’s delta with respect to the underlying asset’s price. A negative gamma for market makers (dealers) can lead to increased hedging activity, which can exacerbate price swings. In this context, a negative gamma flip could mean dealers become more inclined to sell Bitcoin as the price rises, contributing to resistance.
- Liquidation Shelf: Running up to $86,000, this zone likely contains a significant number of leveraged positions that could be liquidated if the price moves higher, potentially leading to cascading sell-offs.
- Patient Supply Wall: As mentioned, this refers to the LTH supply that has patiently held positions, with the primary wall forming between $83,000 and $86,000.
Collectively, these structures indicate that the band between $81,000 and $86,000 represents a critical juncture where the demand driving the current recovery will meet its most significant test.
Converging Technical Indicators Signal Resistance
Beyond the on-chain liquidity analysis, traditional technical indicators are also converging around this price area, reinforcing its significance as a resistance hurdle. Multiple established price trend lines are aligning, creating a confluence that traders closely monitor.
Exponential Moving Averages (EMAs) and Volume-Weighted Average Price (VWAP)
Data from TradingView reveals that Bitcoin’s 50-week and 100-week Exponential Moving Averages (EMAs) are currently situated at approximately $77,353 and $78,485, respectively. These longer-term EMAs are often seen as key indicators of the prevailing trend. While Bitcoin has been trading above these levels, a sustained push beyond them is required to confirm a robust uptrend.
Adding to this technical picture is the 365-day volume-weighted average price (VWAP). The VWAP, which accounts for trading volume throughout the day, is currently hovering around $82,600. This metric provides a volume-adjusted benchmark for the average price of an asset over a specific period. Its proximity to the identified on-chain resistance zone further amplifies the psychological and technical significance of the $81,000-$86,000 corridor.
The convergence of these indicators suggests that a significant amount of market participants are watching these levels. A failure to decisively break through and hold above this confluence of technical lines could signal a continuation of consolidation or a potential reversal.
Historical Context and Market Sentiment
The recent price action of Bitcoin has been characterized by a rapid rebound following periods of decline. This has led to a degree of skepticism among some market participants regarding the sustainability of these gains. Cointelegraph has previously reported on this sentiment, noting that the speed of the recovery has prompted questions about its underlying strength.
Trader and analyst Rekt Capital has emphasized the importance of Bitcoin holding the 50-week EMA for an extended period before any meaningful trend change can be definitively declared. This perspective underscores the cautious approach many are taking, waiting for concrete evidence of sustained upward momentum rather than reacting to short-term price fluctuations.
Furthermore, broader market analyses suggest that the current cycle might still be subject to bear market timing patterns, with some projections indicating that such conditions could persist until the end of 2026. This long-term outlook implies that while rallies are expected, the path to new all-time highs could be a protracted and challenging one, punctuated by significant resistance levels like the one currently being encountered.
Implications for the Bitcoin Market
The confluence of on-chain liquidity structures and technical indicators in the $81,000-$86,000 range carries significant implications for the short-to-medium term trajectory of Bitcoin.
Potential for Increased Volatility: As Bitcoin approaches this resistance zone, increased trading activity and heightened emotions are likely. Traders and investors will be closely watching for a decisive breakout or a rejection. A strong rejection from this level could lead to a pullback, potentially testing lower support levels, while a convincing breakout could signal the start of a new upward leg.
The Resolve of Long-Term Holders: The behavior of LTHs will be a critical determinant. If they remain steadfast in their conviction and resist selling at breakeven or minimal profit, it would indicate strong underlying belief in Bitcoin’s future appreciation and could facilitate a smoother passage through this resistance. Conversely, a wave of selling from LTHs could create significant selling pressure, hindering upward momentum.
Impact on Market Sentiment: The outcome of this resistance test will likely influence broader market sentiment. A successful breakout could reignite bullish enthusiasm and attract new capital into the market. However, a failure to overcome this hurdle could reinforce existing skepticism and potentially lead to profit-taking among shorter-term traders.
Strategic Positioning of Market Participants: The presence of various liquidity structures, including those related to dealers and leveraged positions, suggests that sophisticated market participants are actively managing their exposures around these price levels. Their actions, whether through hedging, re-laddering orders, or outright liquidation, will play a crucial role in shaping price dynamics.
The current phase for Bitcoin is characterized by a critical battle between buying pressure and significant selling interest concentrated in a specific price band. The ability of Bitcoin to overcome the $81,000-$86,000 resistance will be a pivotal moment, offering insights into the strength of the current bull run and the long-term conviction of its holders. As the market digests this data, a period of heightened observation and potentially increased volatility is expected.
This article is produced in accordance with Cointelegraph’s Editorial Policy and is intended for informational purposes only. It does not constitute investment advice or recommendations. All investments and trades carry risk; readers are encouraged to conduct independent research.