
Bitcoin (BTC) is embarking on a new trading week under the shadow of escalating macroeconomic risks, a scenario amplified by a sharp decline in gold prices and a collective market anticipation for a potential retest of the $50,000 support level. The digital asset’s recent struggles to maintain key technical levels, coupled with broader market anxieties, have created a complex and uncertain trading environment.
Bitcoin’s Weekly Close Undermines Key Technical Support
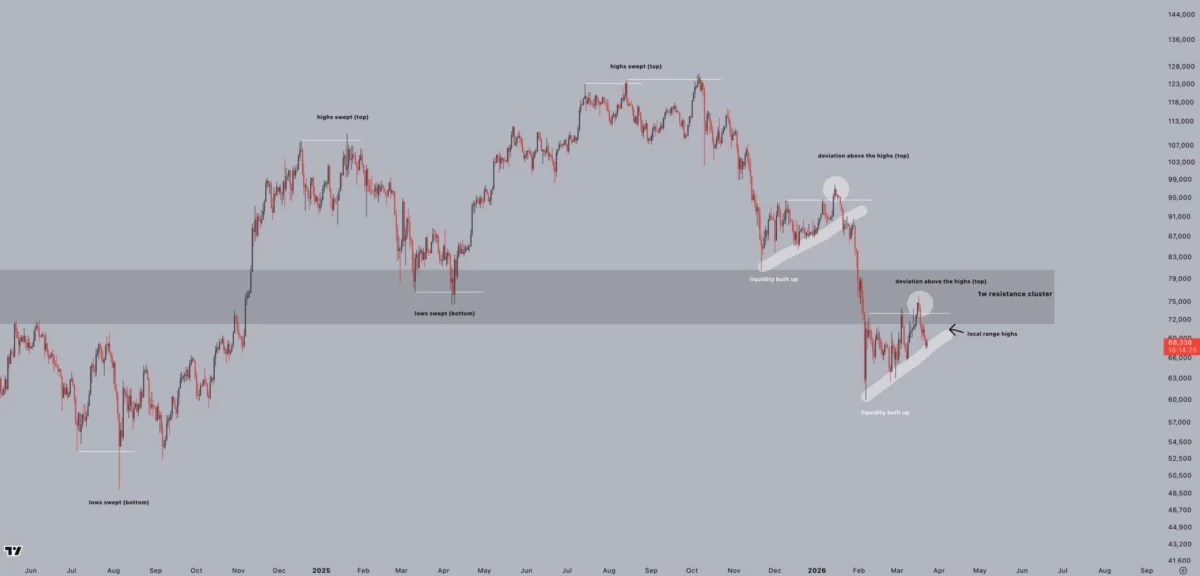
Following a tumultuous weekend that saw significant price volatility, Bitcoin found itself struggling to regain crucial support levels as traditional finance (TradFi) markets reopened. Data from TradingView indicates that BTC dipped to approximately $67,400 leading into the weekly close, a move that resulted in the breach of the significant 200-week exponential moving average (EMA) trend line. This particular moving average, currently situated around $68,300, had previously been identified by analysts as a critical barometer for bullish strength and a key line of defense for the cryptocurrency’s upward trajectory.

The loss of this long-term technical indicator has raised concerns among traders and analysts about the potential for further downside. The 200-week EMA is often viewed as a measure of the long-term health of an asset’s trend, and its breakdown can signal a shift in market sentiment. The chart accompanying this analysis illustrates the BTC/USD pair’s position relative to this critical moving average.
Geopolitical Tensions and Range-Bound Trading Outlook
The prevailing market sentiment appears to be heavily influenced by geopolitical developments. In an analysis shared on Sunday, crypto trader CrypNuevo highlighted the ongoing dependence of the Bitcoin market on global political events. "It feels like we’ll be stuck in this range for the next month too," CrypNuevo summarized, suggesting a period of consolidation rather than a decisive breakout.
He further elaborated on the potential for near-term volatility, stating, "We could see some conflict escalation (uncertainty) next week that could trigger a new visit to the range lows where an interesting 4h long wick still sits there." This reference points to a notable swing low observed in early February, when Bitcoin briefly dipped below the $60,000 mark.

Looking at shorter timeframes (LTF), CrypNuevo indicated a preference for a potential price rotation towards $65,000 in the coming week. He suggested a strategic entry point around $70,000, anticipating a possible short-lived upward push at the start of the week. However, he cautioned against excessive optimism, noting that acceptance above $71,000 would invalidate this bearish outlook and potentially lead to a rapid ascent towards $73,000-$74,000. The accompanying chart illustrates the BTC/USDT four-hour price action, offering a visual representation of these potential trading ranges.
Liquidation Waves and Short Squeeze Potential
The start of the week also saw continued liquidation activity. Data from CoinGlass revealed that over $400 million in cryptocurrency positions were liquidated within a 24-hour period on Monday, underscoring the ongoing volatility and risk within the market. High liquidation levels often indicate significant leverage within the market and can exacerbate price movements.
Trader Castillo Trading identified liquidity stacked above the current price as a potential catalyst for a short squeeze. In a post on X (formerly Twitter), Castillo Trading expressed a favorable risk-reward ratio for upside potential from the current levels, suggesting that even a slight dip below $67,200 might still present a worthwhile opportunity for a speculative trade. The attached chart and accompanying text illustrate this trading thesis.

Understanding Weekend Price Distortions
Onchain analytics platform CryptoQuant offered insights into the nature of weekend price action, suggesting that the observed volatility was not entirely unusual. Contributor XWIN Research Japan, in a "QuickTake" blog post, explained that during weekends, institutional participation typically dwindles, and spot-driven demand, particularly from ETF flows, effectively pauses. This reduction in liquidity makes the market more susceptible to fluctuations driven by derivatives positioning and short-term liquidity conditions.
"Lower liquidity also amplifies price sensitivity," the analysis noted. "With thinner order books, relatively small sell orders can trigger larger price movements, often leading to cascading effects such as stop-loss activation or liquidation events." Consequently, XWIN stressed that weekend price movements "should not be interpreted as a signal of trend continuation or reversal." The provided screenshot from CryptoQuant depicts Bitcoin’s price action on a Sunday, illustrating the potential for amplified movements during periods of lower trading volume.
Echoes of January’s Bear Flag Breakdown
A significant concern for Bitcoin bulls this week is the potential for a repeat of a bearish pattern observed in January. Traders are closely watching for the formation and potential breakdown of a "bear flag" on the daily chart. This pattern typically involves a sharp decline followed by a period of consolidation, which can create the illusion of a trend reversal before the price breaks lower, continuing the original downtrend to new lows.

As previously reported, analysts had warned of the possibility of a second bear flag forming after the initial pattern concluded in January. The current price action is drawing parallels to this earlier event. Trader Roman observed that the market "looks almost exactly the same. Bear Flag Breakdown & Retest with low volume on the upward move," shortly after Bitcoin reached six-week highs of $76,000. This sentiment suggests that the recent upward momentum may have lacked conviction, increasing the risk of a subsequent decline.
Trader Jelle further emphasized this bearish outlook, suggesting that Bitcoin had already broken key support levels. "Not a great way to start the week if you’re a bull," he warned. "Consolidate here for a day or two and those untapped lows look ripe for the taking." His accompanying chart illustrates this potential downside scenario.
Adding to these concerns, Keith Alan, co-founder of trading resource Material Indicators, suggested that the target for a measured move down from this bear flag pattern could extend below the $50,000 mark. This projection highlights the potential severity of a breakdown if the bearish pattern plays out as anticipated. The attached tweet from Material Indicators provides a visual representation of this potential target.

Gold Enters Bear Market Amidst Middle Eastern Energy Concerns
The escalating global energy crisis, with a particular focus on the Middle East, is exerting pressure not only on risk assets but also on traditional safe havens, including gold. Asian stock markets experienced declines in their opening sessions, and gold and silver prices came under significant selling pressure. Bitcoin mirrored this trend, reaching two-week lows around its Sunday weekly close.
The trading resource The Kobeissi Letter noted that the erratic price movements in gold could indicate the liquidation of a significant market participant. "The sporadic moves in price could signal that a potential large player in the space is being liquidated," the firm stated. They further attributed this pressure to rising US 10-year treasury note yields, which are "beginning to weigh on various asset classes." The combination of these factors, along with "headline fatigue and ‘pockets’ of illiquidity in the market," is contributing to widening price gaps in both directions. The firm concluded that "Something big is happening [in] metals markets right now."
With a decline of over 20% from its all-time high, the XAU/USD (gold) pair has officially entered bear market territory, reaching local lows of $4,099 per ounce. This level has not been seen since November 2025.

Meanwhile, crude oil prices are hovering precariously above the $100 per barrel mark, fueled by ongoing uncertainty surrounding oil flows through the Strait of Hormuz. In its newsletter "The Market Mosaic," Mosaic Asset Company highlighted the potential impact of rising oil prices on future US inflation figures. "Oil prices are directly correlated to headline inflation, where a $10 increase per barrel can push inflation higher by 0.20% or more," the firm stated. They also noted that even before the recent escalation of conflict in the Middle East, there were already indications of an upward inflection in inflation. The provided chart illustrates the daily price action of WTI crude oil futures.
Risk Assets Seek Solace Amidst Hawkish Fed Stance
The economic calendar for the upcoming week offers limited key inflation reports, with jobless claims and S&P Flash Purchasing Managers’ Index (PMI) data taking center stage. In recent months, cryptocurrency markets have demonstrated sensitivity to PMI releases, particularly as US manufacturing activity has shown signs of recovery after a prolonged period of contraction.
Concurrently, headwinds from geopolitical tensions are intensifying, a sentiment echoed by the hawkish tone adopted by the US Federal Reserve at its previous meeting. Following the decision to maintain interest rates unchanged, Federal Reserve Chair Jerome Powell indicated that any future policy easing would be contingent on "progress" being made in bringing down inflation.

Mosaic Asset Company observed that "the market is quickly repricing the outlook for rate cuts." While current market-implied odds do not suggest another rate cut for over a year, some indicators point towards the possibility of further rate hikes. This conservative stance from the Fed comes despite signs of weakening US labor market conditions, which traditionally would prompt a reassessment of restrictive monetary policies.
Despite these challenges, a potential silver lining for risk assets may lie in historical market patterns. As previously reported, Bitcoin’s correlation with US stocks has strengthened recently. Mosaic Asset Company suggested that "conditions across breadth and sentiment are evolving to support a rally in the S&P 500." They added that "historic precedent for market movements around major geopolitical events also hint that a rebound could be in store for the stock market."
The Kobeissi Letter echoed this sentiment, noting "skyrocketing" trading activity across stock markets and the significant options expiry event last week, which has potentially freed up substantial capital. "Friday’s volume was also amplified by ~$5.7 trillion in options tied to US stocks, indexes, and ETFs expiring in the largest March triple-witching in at least 30 years," the firm reported on X. This massive volume of expired options has released billions in capital, which "could drive significant market swings this week. Brace for more market volatility." The accompanying chart illustrates the S&P 500 ETF with volume data.

Bitcoin’s Long-Term Holders Face Capitulation
Even without a significant revisit to the lower bounds of its trading range, Bitcoin’s long-term holders (LTHs) are currently experiencing considerable pressure. Research from CryptoQuant, utilizing the Spent Output Profit Ratio (SOPR) metric, has revealed signals of "capitulation" among this cohort. The SOPR metric measures whether coins transacted on-chain are doing so at a profit or loss relative to their acquisition cost.
Readings below 1 indicate that the observed supply is, in aggregate, being transacted at a loss. On March 11, the Bitcoin Long-Term Holder SOPR dropped to 0.64, signifying that LTHs were selling their holdings at an average loss of 36% relative to their cost basis. This marked one of the most extreme capitulation readings for LTHs in recent months.
"A value this far below 1.0 indicates that even patient, conviction holders were being shaken out, a sign of genuine fear in the market," commented contributor The Enigma Trader. The chart displays the Bitcoin LTH-SOPR with its 30-day moving average, illustrating the depth of this recent sell-off.

Interestingly, while the 30-day moving average of LTH-SOPR remains below 1, large volumes of Bitcoin have been observed leaving exchanges, hinting at a potential emerging accumulation trend. "One possible interpretation: while long-term holders were capitulating between March 10–20, a separate cohort was quietly absorbing supply and moving coins off exchanges," the analysis continued. This simultaneous distribution and accumulation could represent a classic "phase transition setup" within the market cycle.